- 21 reads
Source: U.S. Dept. of Energy

All energy reduction tactics are not created equal, especially when it comes payback times. Like any investment, some have higher returns and quicker payback than others. The U.S. Mid-Range Abatement Curve (Fig. 3) is a powerful indicator for private sector managers to make smart investments in powerful cost savings.
Initiatives to the left are most cost-effective in savings, reducing energy waste, and, in turn, reducing CO2 emissions.
G-ROI® Ranked by Type of Investment
- Commercial Buildings: LED Lighting
- Commercial Buildings: New Shell Improvements
- Commercial Buildings: Combined Heat and Power
- Onshore Wind: Medium Penetration
- Distributed Solar PV
- Coal Power Plants: CCS New Builds with EOR
- Onshore Wind: High Penetration
- Commercial Buildings: HVAC Equipment Efficiency
- Solar CSP
- Car Hybridization
Source: 2009 Report on Global Warming by McKinsey & Co.
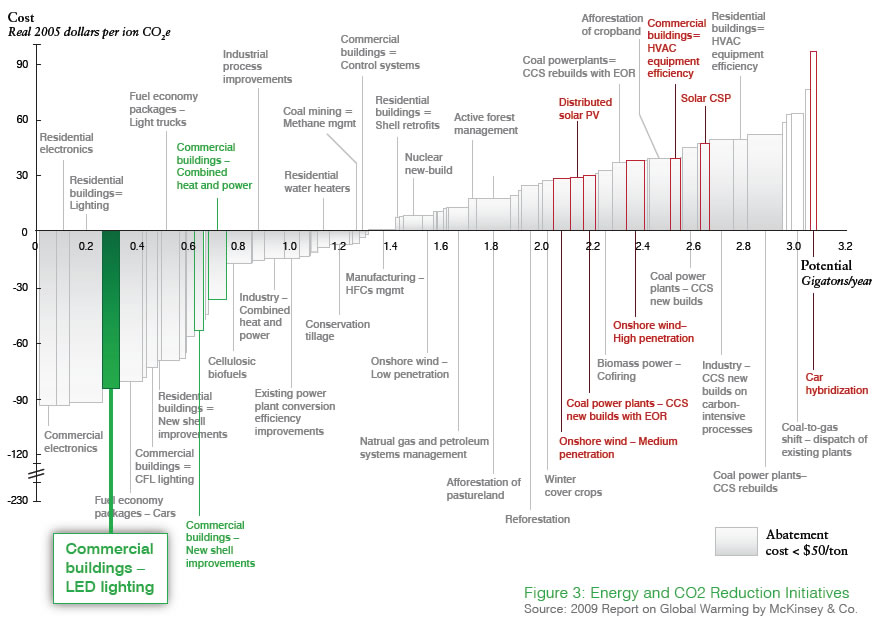

Figure 4: U.S. Energy Cost Per Employee
Source: GREENandSAVE.com and U.S. Dept. of Energy
Performance metrics are key to smart management. When analyzing costs managers find cost as a percentage of total energy higher with traditional lighting. Very few facilities run sub-meters on lighting, and do not go through the electricity bill line-by-line. The real cost of lighting is often hidden. Fig. 4 highlights both the average percentage of lighting relative to total energy for a typical U.S. office, and average cost per employee.
Managers may use this back-of-the-napkin tool to estimate opportunities for savings with LED lights. LEDs reduce operating costs by 50%, and savings are approximately $60 per employee per year.